Chart gallery
Every chart on this site is generated from the live analysis by scripts/build_visuals.py, not drawn by hand. Re-run it after any change to the data or the framework and every figure updates together, so a chart cannot disagree with the scorecard behind it.
python scripts/build_visuals.py
Each is written as both PNG at 200 dpi, for the deck, and SVG, for this site.
Where the market’s growth comes from
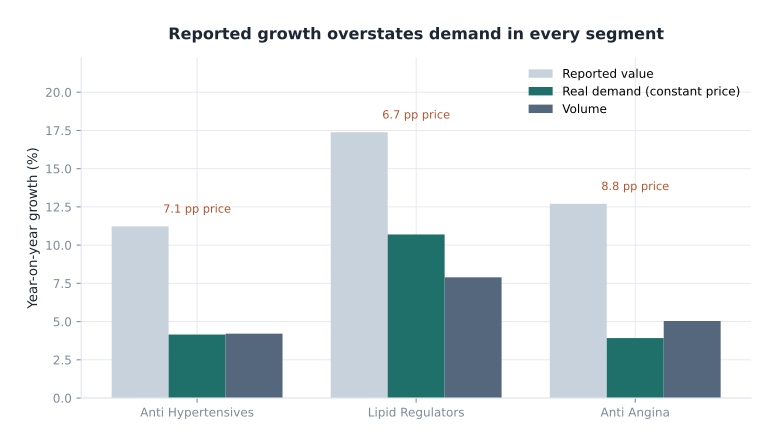
Three readings of the same market. Reported value moves on price and demand together. Constant-price MAT holds prices at the prior year, so its growth is demand. Quantity confirms it. The gap between the first two bars is the price contribution, and it is substantial in every segment.
This is why reported value growth carries no weight in the framework’s future-potential pillar.
Opportunity against right to win
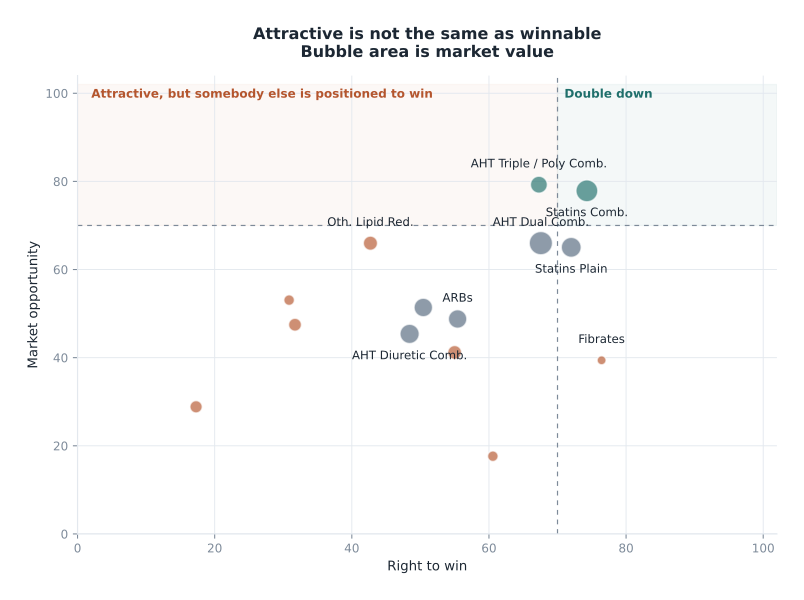
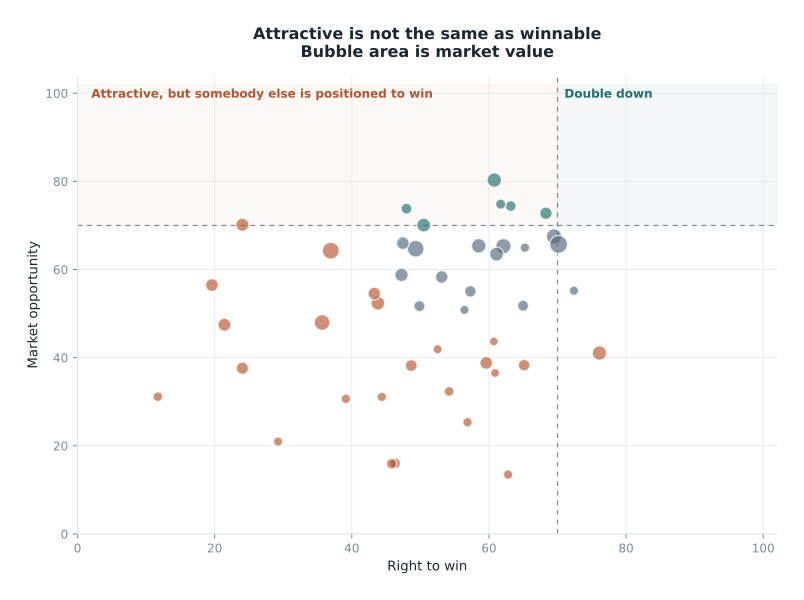
The vertical axis rates a space for anybody. The horizontal axis asks whether Cipla specifically can win it. The top-right quadrant is where to spend. The top-left is a real opportunity that somebody else is positioned to win, and naming those is as useful as naming the targets.
The same view at molecule-combination level, which is where a launch decision is actually taken:
The ranked shortlist
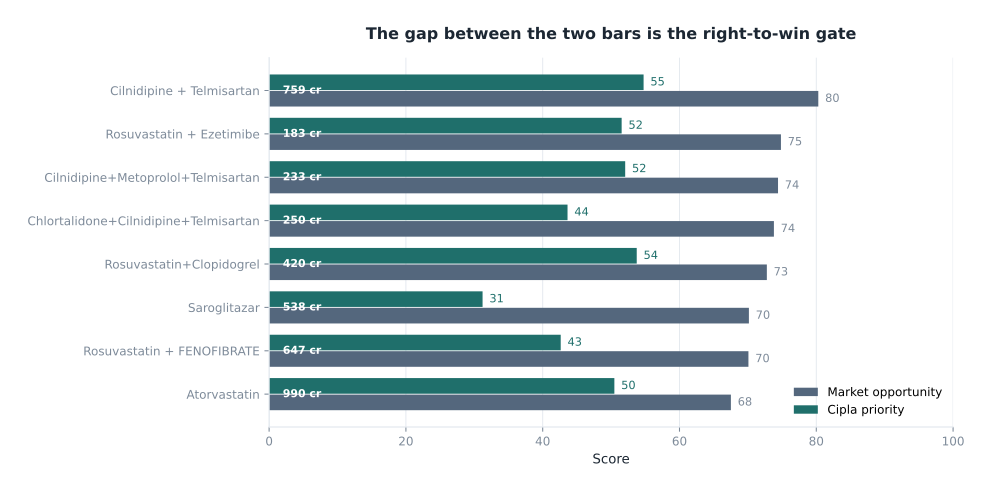
Two bars per space. The upper bar is the market opportunity index; the lower is that index after the right-to-win gate. The distance between them is the cost of not being positioned.
Growth against concentration
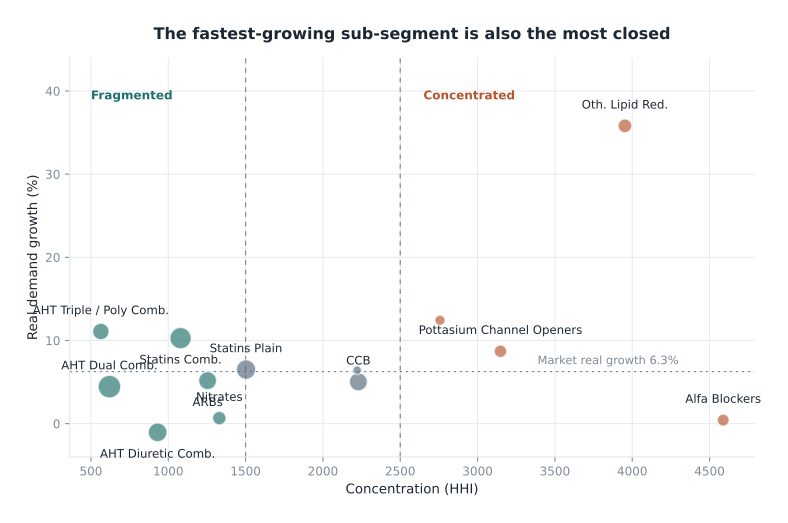
The fastest-growing sub-segment in the market is also the most concentrated. A framework that ranked on growth alone would recommend it. The competitive-headroom pillar exists to catch exactly this pattern.
Where Cipla stands
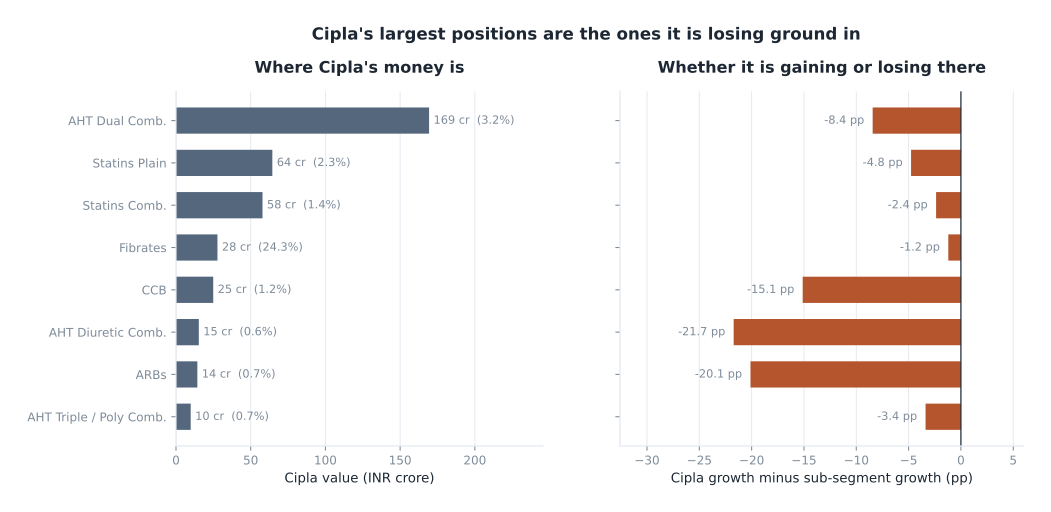
On the left, where Cipla’s cardiac revenue sits. On the right, whether it is gaining or losing ground in each of those spaces. The largest positions are the ones losing ground, which is the central tension in the recommendation.
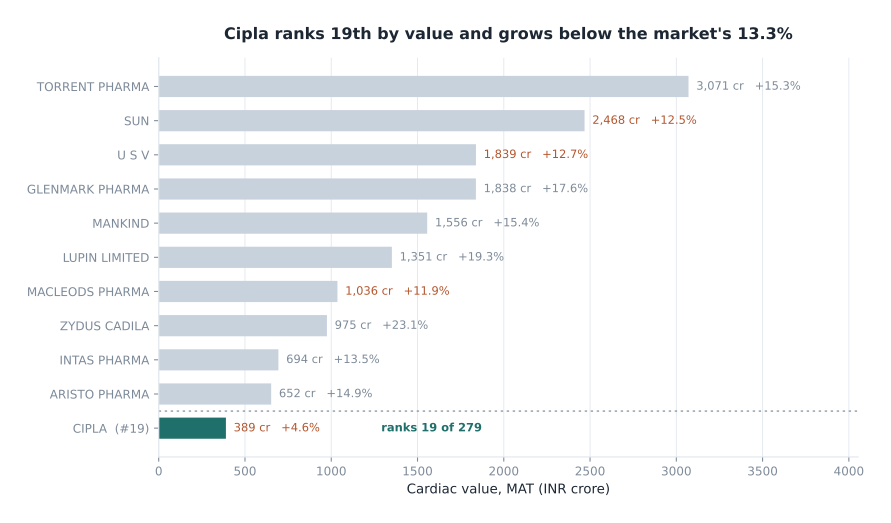
Underpenetration
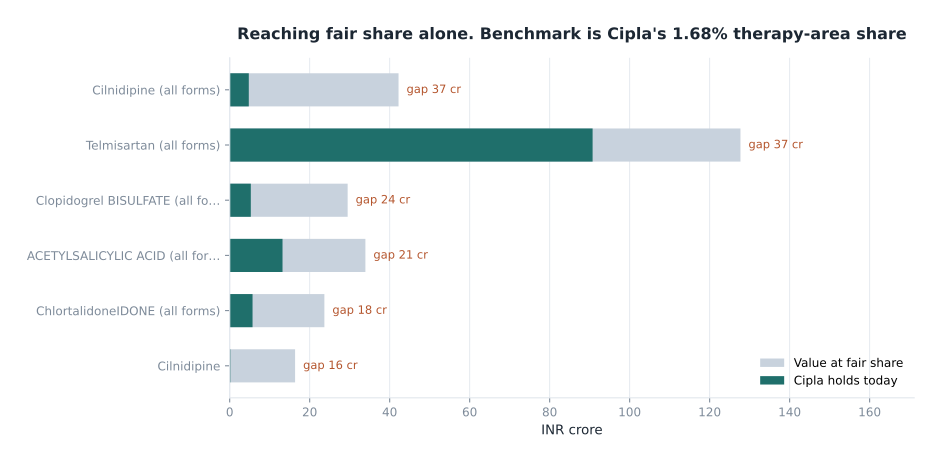
The pale bar is what Cipla would hold at its fair share of each franchise. The solid bar is what it holds today. The difference is the prize from reaching parity alone, before any share gain.
Anchor-molecule franchises overlap by design, so read them as franchises rather than adding them up.
Why one space is a priority and another is not
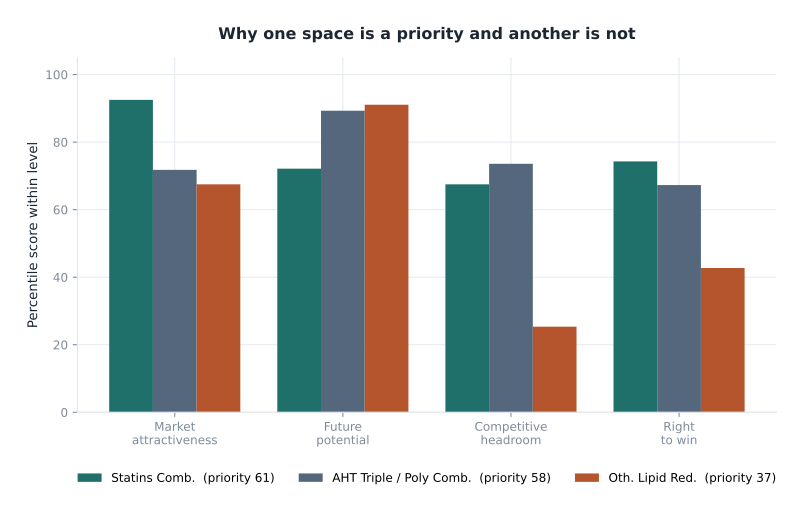
The same three sub-segments, broken into the four pillars. Other Lipid Reducers scores well on future potential and poorly on competitive headroom and right to win, which is what moves it from sixth on attractiveness to a harvest verdict.
Robustness
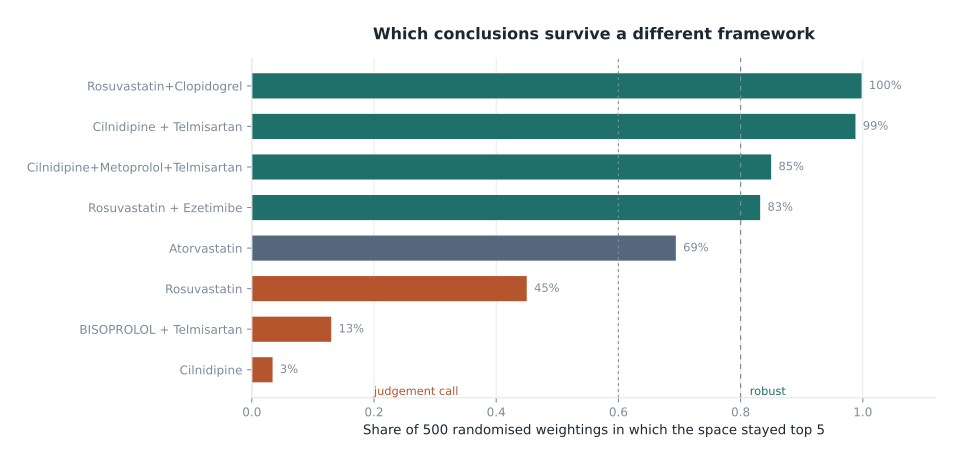
Every weight block redrawn from a Dirichlet distribution centred on the configured values, and the market re-scored 500 times. The bar is how often each space stayed in the top five. Above 80 per cent the recommendation survives almost any reasonable weighting; below 60 per cent it is a judgement call and is presented as one.
The five-year view
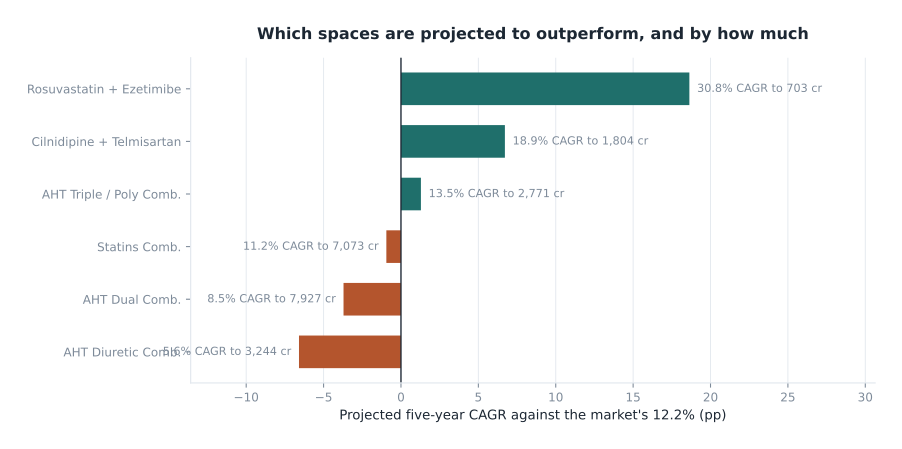
Projected five-year CAGR against the market’s rate. Growth mean-reverts towards the therapy-area rate, so nothing is projected to sustain its current rate. These are structured extrapolations from two years of history, not plans.