Case answers
All figures are MAT February 2026 unless stated, in INR crore, produced by the deterministic analytics engine. External claims carry a [S-xx] citation resolved in APPENDIX_SOURCES.md.
Reproduce any figure with:
cardiac-agent rank --level molecule_combination --by market_opportunity_index
cardiac-agent whitespace
cardiac-agent sensitivity --level sub_segment --top-k 3
The starting position
The Cardiac market in this dataset is worth ₹23,244 crore, growing 13.3 per cent year on year. Constant-price growth is 6.3 per cent and volume growth 5.1 per cent, so roughly 7.0 percentage points of the headline growth is price, not demand. That distinction runs through everything below, and it is the organisers’ own guidance on how to read MAT against MAT CP [S-14]. It also matters commercially: a material part of the essential cardiovascular basket sits under administered ceiling prices, so price-led growth is structurally fragile [S-07].
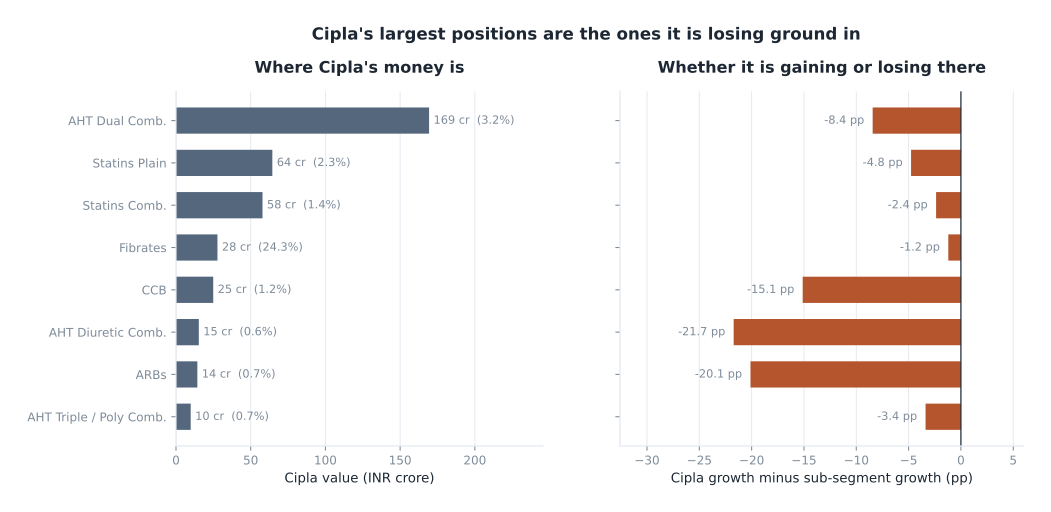
Cipla holds ₹389.5 crore, a 1.68 per cent share, growing 4.6 per cent. That is 8.7 percentage points behind the market. Cipla is not losing money in Cardiac; it is losing relative position every year it stands still, and it ranks nineteenth by value in a market where the top five hold roughly 46 per cent.
Its estate is five umbrella franchises and little else:
| Franchise | Value | Growth | Anchor |
|---|---|---|---|
| AMLOPRES | ₹148.4 cr | +3.3% | Amlodipine |
| ATORLIP | ₹59.8 cr | +6.2% | Atorvastatin |
| ROSULIP | ₹54.3 cr | +18.1% | Rosuvastatin |
| CRESAR | ₹51.2 cr | -5.4% | Telmisartan |
| FENOLIP | ₹27.7 cr | +14.1% | Fenofibrate |
Only one of the five is growing faster than the market.
Question 1. Top opportunities, and which two or three to prioritise
The top five, ranked on market attractiveness alone
Ranked by Market Opportunity Index at the molecule-combination level, which is where a launch decision is actually taken.
| # | Space | Size | Growth | Real growth | Volume | HHI | Leader | MOI |
|---|---|---|---|---|---|---|---|---|
| 1 | Cilnidipine + Telmisartan | ₹759 cr | 28.3% | 19.7% | 18.7% | 1,747 | Torrent 38.1% | 80.3 |
| 2 | Rosuvastatin + Ezetimibe | ₹183 cr | 87.7% | 79.4% | 77.2% | 1,313 | USV 21.1% | 74.8 |
| 3 | Cilnidipine + Metoprolol + Telmisartan | ₹233 cr | 31.9% | 26.9% | 30.7% | 1,170 | Ajanta 23.2% | 74.4 |
| 4 | Chlortalidone + Cilnidipine + Telmisartan | ₹250 cr | 24.7% | 15.2% | 17.4% | 874 | Mankind 14.7% | 73.8 |
| 5 | Rosuvastatin + Clopidogrel | ₹420 cr | 21.3% | 14.5% | 16.8% | 1,203 | Sun 21.6% | 72.8 |
Saroglitazar would rank sixth at 70.2 on attractiveness. It is excluded from the shortlist deliberately, and the reason is Question 4.
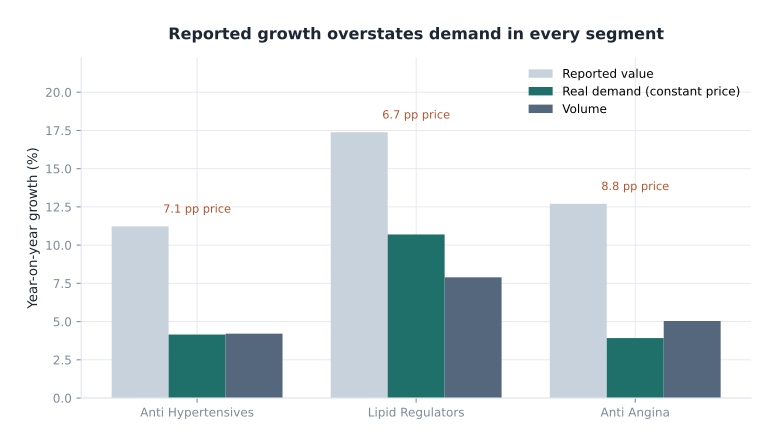
Two patterns fall out. Every one of the five is a fixed-dose combination, which is consistent with Indian hypertension guidance moving from sequential monotherapy to early single-pill combination therapy [S-08]. And in every one the constant-price and volume lines move together with reported value, so this is demand growth rather than price.
Which two or three Cipla should actively prioritise
Ranked on Cipla Priority Score, which is the same index passed through a right-to-win gate.
Priority 1. Statin combinations, entered through the ezetimibe extension.
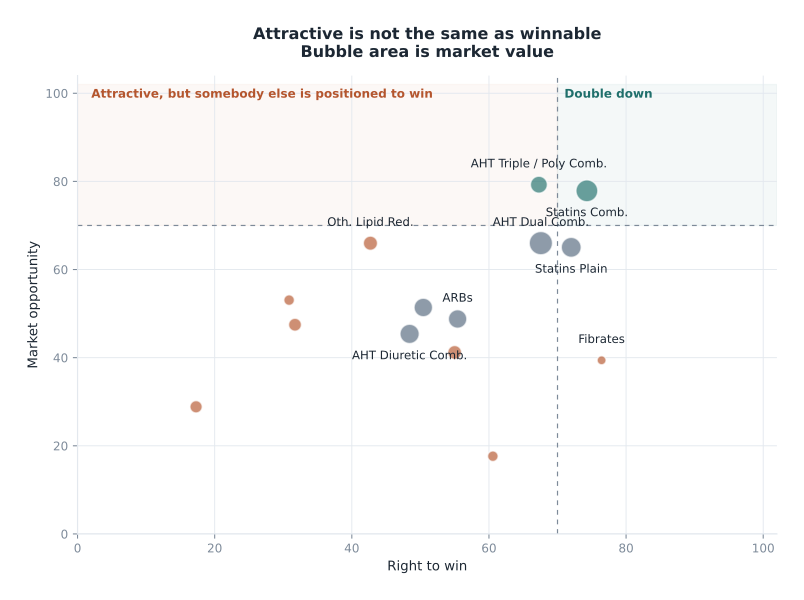
The sub-segment is ₹4,154 crore growing 17.4 per cent, with real growth of 10.3 per cent and volume of 7.6 per cent. It is fragmented: HHI 1,080 across 143 players, the leader USV holding 25.0 per cent. Cipla has ₹57.9 crore at 1.39 per cent share, growing 15.1 per cent, and it is the only sub-segment the framework rates “Double down” (MOI 77.9, right to win 74.3, priority 61.1). It survived 100 per cent of 500 randomised weightings in the top three.
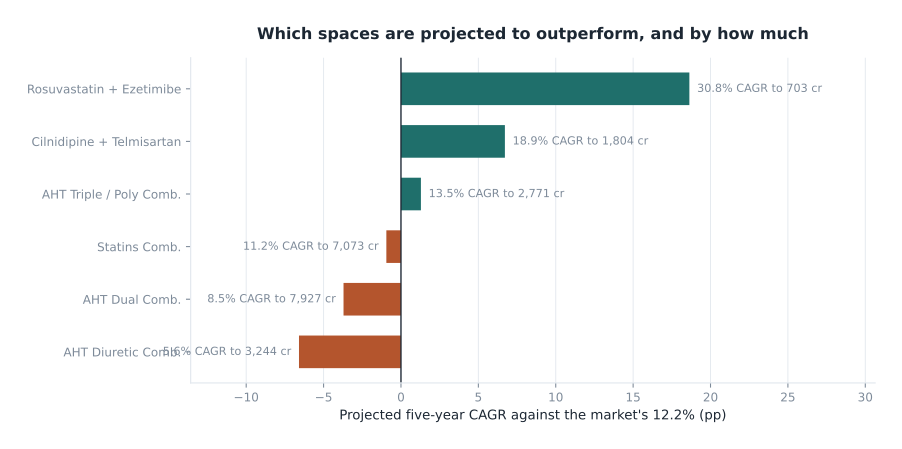
The sharp version of this recommendation is not “do more in statin combinations”. It is the ezetimibe extension specifically. Rosuvastatin + Ezetimibe is ₹183 crore growing 87.7 per cent, with 79.4 per cent of that real and 77.2 per cent volume, across 33 players with 12 new entrants in the last year and no established leader above 21 per cent. Cipla launched ROSULIP EZ from a standing start to ₹0.99 crore. Indian lipid guidance places ezetimibe first in the escalation sequence after a maximally tolerated statin [S-03], and bempedoic acid plus ezetimibe is forming behind it [S-10]. Projected forward five years the space reaches ₹703 crore, 18.6 percentage points ahead of the market.
Cipla’s right to win here is concrete rather than aspirational: ROSULIP is a ₹54.3 crore franchise growing 18.1 per cent, the fastest of its five, and the extension carries the brand rather than starting from nothing.
Priority 2. Cilnidipine-anchored combinations, entered through CRESAR.
Summed across every pack containing it, the cilnidipine franchise is ₹2,519 crore growing 21.5 per cent, with 13.1 per cent real and 12.9 per cent volume. No level of the standard reporting hierarchy shows this, because the molecule sits in a plain CCB, three dual combinations and two triples at once. The agent’s anchor-molecule level exists to surface exactly this [S-11].
Cipla holds 0.19 per cent of it, ₹4.8 crore, growing 40.3 per cent.
The entry point matters more than the decision to enter. Plain cilnidipine is Torrent’s: ₹976 crore at HHI 3,261, with CILACAR alone at ₹538 crore. Attacking that is a frontal assault on an entrenched leader. The combination layer is a different market:
| Layer | Size | Growth | HHI | Leader share |
|---|---|---|---|---|
| Cilnidipine plain | ₹976 cr | 16.8% | 3,261 | 55.4% |
| Cilnidipine + Telmisartan | ₹759 cr | 28.3% | 1,747 | 38.1% |
| Chlortalidone + Cilnidipine + Telmisartan | ₹250 cr | 24.7% | 874 | 14.7% |
| Cilnidipine + Metoprolol + Telmisartan | ₹233 cr | 31.9% | 1,170 | 23.2% |
Share is still being allocated in the triples, not defended. Cipla already sells CRESAR LN, a cilnidipine plus telmisartan pack at ₹2.0 crore growing 27.9 per cent, and CRESAR is a ₹51.2 crore telmisartan franchise. Cilnidipine + Telmisartan projects to ₹1,804 crore over five years, 6.7 percentage points ahead of the market, and held its top-five position in 98.8 per cent of randomised weightings.
Priority 3, selective. Rosuvastatin + Clopidogrel.
₹420 crore growing 21.3 per cent, real 14.5 per cent, HHI 1,203 across 68 players. Cipla holds ₹2.9 crore and is already growing at 29.1 per cent, 7.8 percentage points ahead of the space. It is the most robust space in the whole molecule-level ranking, holding its position in 99.8 per cent of randomised weightings. It is listed third because it is a share-gain play inside an existing franchise rather than a new capability, so it should be funded from the ROSULIP line rather than as a separate initiative.
Key metrics used
| Pillar | Metrics | Weight |
|---|---|---|
| Market attractiveness | MAT value, absolute value added, two-year CAGR | 34% |
| Future potential | Constant-price growth, volume growth, three-month momentum, external-signal tilt | 40% |
| Competitive headroom | HHI, leader share, players per ₹100 crore, price erosion | 26% |
| Right to win (gate) | Cipla share, share momentum, molecule adjacency, brand franchise, detailing adjacency, formulation fit | multiplier |
Trade-offs observed, and how they were resolved
Size against growth. AHT Dual Combinations is the largest space in the market at ₹5,280 crore, and Cipla’s strongest position at 3.21 per cent. But its real growth is 4.45 per cent against reported 12.57 per cent, so two thirds of its growth is price. Statin Combinations is smaller at ₹4,154 crore and grows 10.3 per cent in real terms. Resolved towards real growth, because price gains do not compound under an administered ceiling [S-07] and the framework weights constant-price and volume growth above reported value for that reason.
Growth against competition. Other Lipid Reducers is the fastest-growing sub-segment at 45.6 per cent. It is also the most concentrated, at HHI 3,953 with Zydus holding 60.0 per cent, and most of the growth sits in an originator-controlled molecule [S-06]. Resolved towards accessibility. The competitive-headroom pillar exists to catch precisely this pattern, and it moves the space from sixth on attractiveness to a “Harvest or exit” verdict at priority 36.7.
Attractiveness against right to win. Rosuvastatin + Ezetimibe scores 74.8 on attractiveness but is only ₹183 crore today. Cilnidipine + Telmisartan scores higher on attractiveness at 80.3 and is four times the size, but Cipla holds 0.26 per cent of it against Torrent’s 38.1 per cent. Resolved by sequencing rather than by choosing. The ezetimibe extension is funded first because it is a brand extension into a category Cipla already sells, which is months of work rather than years. The cilnidipine build runs behind it, entered at the triple layer where no incumbent has consolidated.
Current share against share momentum. Cipla’s largest cardiac position, AMLOPRES at ₹148.4 crore, grows 3.3 per cent in a sub-segment growing 12.6 per cent. Its smallest meaningful positions grow fastest. Resolved towards momentum, which is why the right-to-win pillar weights share momentum equally with current share.
Question 2. Cipla’s right to win, against the key competitors
| Company | Cardiac value | Share | Growth | Spaces led | Strongest positions |
|---|---|---|---|---|---|
| Torrent Pharma | ₹3,071 cr | 13.21% | 15.3% | 54 | CCB 45%, AHT Dual 12% |
| Sun | ₹2,468 cr | 10.62% | 12.5% | 36 | Statins Plain 35%, Statins Comb 12% |
| USV | ₹1,839 cr | 7.91% | 12.7% | 20 | Statins Comb 25% |
| Glenmark | ₹1,838 cr | 7.91% | 17.6% | 10 | ARBs 30%, AHT Diuretic 24% |
| Mankind | ₹1,556 cr | 6.69% | 15.4% | 6 | AHT Dual 12% |
| Lupin | ₹1,352 cr | 5.81% | 19.3% | 12 | Statins Comb 10% |
| Zydus | ₹975 cr | 4.19% | 23.1% | 11 | Oth. Lipid Red. 60% |
| Cipla | ₹390 cr | 1.68% | 4.6% | 4 | AHT Dual 3%, Statins Plain 2% |
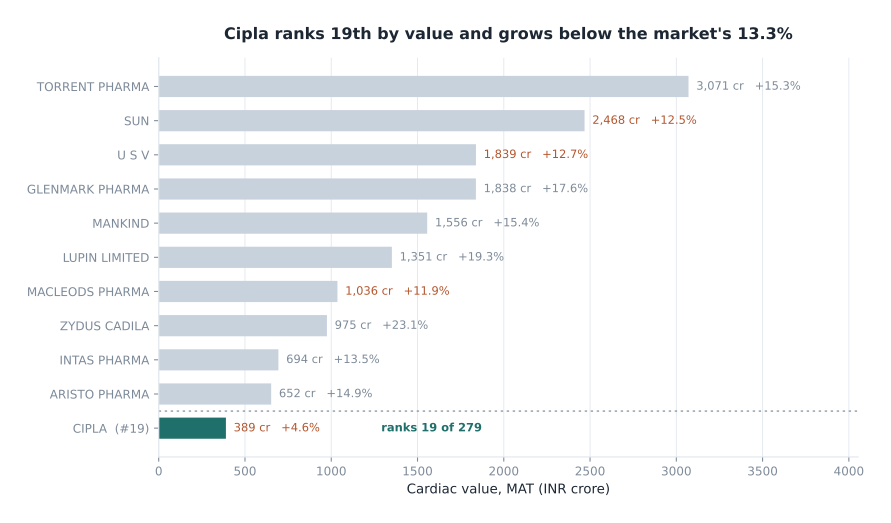
Cipla is roughly one eighth the size of the leader and growing at a third of the market rate. It leads four spaces against Torrent’s fifty-four. Any honest answer starts there: Cipla has no right to win by scale anywhere in this market. What it has is adjacency, and the framework measures it directly.
In statin combinations. Molecule adjacency is 99.4 per cent, meaning Cipla already markets nearly every active ingredient the sub-segment is built on. It has ROSULIP and ATORLIP as extendable umbrella brands, and it is growing 15.1 per cent against USV’s 17.2 per cent and Lupin’s 25.5 per cent. It is not winning, but it is competing. Right-to-win score 74.3, the highest of any sub-segment where the opportunity index is also high.
Against the leaders specifically: USV owns the aspirin-plus-statin configuration through ECOSPRIN-AV at ₹498 crore, and Sun owns the rosuvastatin-plus-fenofibrate configuration through ROSUVAS-F at ₹175 crore. Neither has consolidated the ezetimibe configuration; the largest brand there is ROSEDAY EZ at ₹39 crore in a ₹183 crore space with 12 new entrants last year. That is the gap, and it is open now rather than in three years.
In cilnidipine combinations. Molecule adjacency is 100 per cent and brand franchise scores 1.0, because CRESAR already carries telmisartan and CILOGARD already carries cilnidipine. Against Torrent, which built the category and holds 38.1 per cent of the dual combination, Cipla cannot compete on established brand equity. It can compete on the triples, where Torrent does not lead and the largest player holds 23.2 per cent.
Where Cipla’s strength is real but the market is not. Fibrates: Cipla holds 24.32 per cent share through FENOLIP, second only to USV. It is the strongest competitive position Cipla has anywhere in Cardiac. The sub-segment is ₹114 crore with 6.4 per cent real growth, so it is a cash position rather than a growth platform, and the framework rates it “Harvest or exit” at priority 31.6 despite a right-to-win score of 76.4. That combination, high right to win and low opportunity, is worth naming explicitly.
Question 3. Attractive spaces where Cipla is underpenetrated
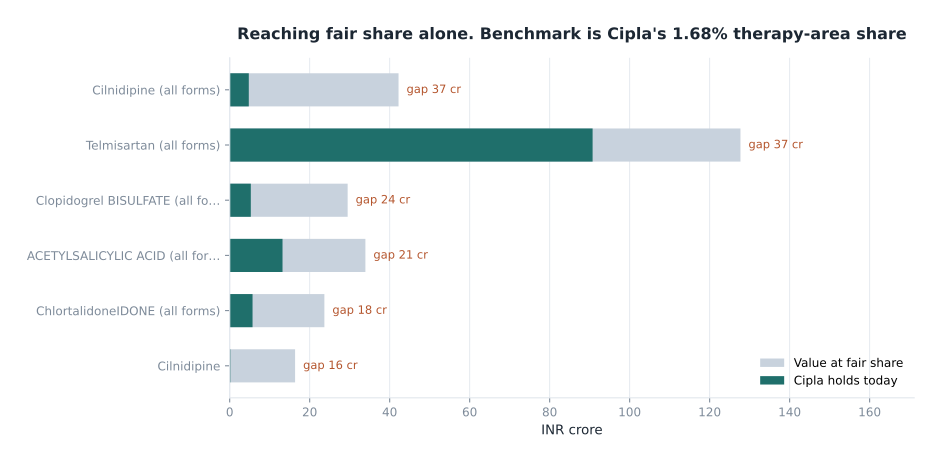
A space qualifies as underpenetrated when three things hold at once: the opportunity index is high, Cipla’s share is below three quarters of its 1.68 per cent therapy-area share, and there is a molecule or brand route in. The third test is what separates a target from a wish.
| Space | Size | Cipla share | Penetration index | Gap to fair share | Route in |
|---|---|---|---|---|---|
| Cilnidipine (all forms) | ₹2,519 cr | 0.19% | 11% | ₹37.4 cr | CILOGARD and CRESAR; 99% molecule overlap |
| Telmisartan (all forms) | ₹7,621 cr | 1.19% | 71% | ₹37.0 cr | CRESAR; 99% molecule overlap |
| Clopidogrel (all forms) | ₹1,760 cr | 0.30% | 18% | ₹24.2 cr | ROSULIP-CV, ATORLIP-CV |
| Acetylsalicylic acid (all forms) | ₹2,025 cr | 0.65% | 39% | ₹20.7 cr | ROSULIP-ASP, ATORLIP GOLD |
| Chlortalidone (all forms) | ₹1,413 cr | 0.40% | 24% | ₹18.0 cr | CRESAR CT; 100% molecule overlap |
The penetration index is Cipla’s share of the space divided by its share of the therapy area. Cilnidipine at 11 means Cipla holds roughly a ninth of what its overall position would imply.
Reaching fair share across these five would be worth roughly ₹137 crore of incremental value, against a current cardiac business of ₹390 crore. These are overlapping molecule franchises rather than five separate markets, so they should be read as one integrated build rather than summed as a target.
What building a position would require
Cilnidipine combinations, 18 to 24 months. File and launch a cilnidipine plus telmisartan pack under CRESAR, where CRESAR LN already exists at ₹2.0 crore growing 27.9 per cent, then a chlortalidone triple. The formulation work is low risk because Cipla already manufactures every component. The real constraint is field-force attention: at 0.19 per cent share the brand has no prescriber recall, and the sub-segment is covered by 103 competing companies. This needs dedicated detailing effort, not a line added to an existing bag.
Ezetimibe combinations, 6 to 12 months. ROSULIP EZ is already launched. The requirement is not development, it is scale: the space grew 87.7 per cent last year and 12 companies entered it. Share allocated in the next eighteen months will be difficult to take back afterwards. This is the shortest path to a defensible position in the entire analysis.
Chlortalidone and clopidogrel adjacencies, opportunistic. Both are already in the portfolio through CRESAR CT and ROSULIP-CV. These are pack and dosing extensions rather than new capabilities, and should be funded from the existing franchise budget.
What would have to be true. Two things this dataset cannot confirm. Freedom to operate on each specific combination needs a patent and regulatory review. And the field-force economics need testing: capturing roughly ₹137 crore of addressable value across sub-segments carrying 103 to 179 competing companies is a share-of-voice question, and this is a retail audit with no cost, margin or promotional data in it.
Question 4. Strategic implications
Double down
Statin combinations, and lipid regulators more broadly. This is the only sub-segment where Cipla has both a high opportunity index and a strong right to win, and it is the single most robust conclusion in the analysis: it stayed in the top three under 100 per cent of 500 randomised framework weightings. Concretely, fund the ezetimibe extension of ROSULIP now and defend the fenofibrate and clopidogrel configurations that already work.
One honest caveat. Projected forward five years, statin combinations grow at 11.2 per cent against a market rate of 12.2 per cent, so the sub-segment as a whole is not expected to outperform. The recommendation rests on the specific configurations inside it, where ezetimibe projects 18.6 percentage points ahead of the market, not on the sub-segment average.
Build capability
Fixed-dose combinations in hypertension, led by the cilnidipine family. AHT Triple and Poly Combinations is the most fragmented sub-segment in the market: HHI 564 across 103 players, the leader holding only 9.45 per cent. It grows 18.6 per cent with 11.1 per cent real and 12.9 per cent volume, and projects 1.3 percentage points ahead of the market. Cipla holds 0.67 per cent, growing 15.3 per cent. There is no incumbent to displace here, which is rare in this market and unlikely to persist.
The capability being built is not manufacturing. It is a hypertension combination franchise with enough prescriber presence to defend a position, which means dedicated field-force capacity rather than an extension of the existing amlodipine bag.
Be selective
AHT Dual Combinations. ₹5,280 crore and Cipla’s largest position at 3.21 per cent, but real growth of 4.45 per cent against reported 12.57 per cent. Defend AMLOPRES and AMLOPRES-AT efficiently, do not fund expansion, and redeploy the field-force time into the triple layer.
Statins plain. ₹2,821 crore growing 6.5 per cent in real terms, with Cipla at 2.29 per cent. This is the base ROSULIP and ATORLIP business and it funds the combination extensions. Maintain it; do not treat it as a growth engine.
Avoid, or partner rather than build
Other Lipid Reducers. The highest-growth sub-segment at 45.6 per cent and the most closed: HHI 3,953, Zydus at 60.0 per cent, and the growth concentrated in an originator-held NCE [S-06]. Cipla’s molecule adjacency here is 9.1 per cent, the lowest of any space examined. The framework rates it “Harvest or exit” at priority 36.7 despite an attractiveness score of 66.0. A prioritisation framework that ranked on growth alone would have put this near the top and been wrong. If Cipla wants exposure to premium lipid innovation the realistic route is in-licensing, which is how inclisiran reached the Indian market [S-05], and that is a business-development decision with a different risk profile.
Anti-Angina. ₹1,157 crore, and Cipla’s share is effectively zero. Nitrates show 0.7 per cent real growth, and Potassium Channel Openers, while growing 18.7 per cent, sit at HHI 3,148 with Torrent holding 52.1 per cent. There is no adjacency and no fragmentation to exploit.
ACE inhibitors and diuretic combinations. ACEi real growth is minus 5.5 per cent. AHT Diuretic Combinations shows reported growth of 7.2 per cent against minus 1.0 per cent real and minus 0.8 per cent volume, which is a price story in a price-controlled basket, and Cipla is declining 14.6 per cent inside it. Harvest CRESAR-H and RAMIPRES; do not defend them with new investment [S-12].
The one-line implication
Cipla cannot win this market by covering it. It can win two configurations inside it, both of which sit next to brands it already owns, and it should stop funding the legacy positions that make its portfolio look broader than its right to win actually is.
How robust are these conclusions
Every weight block was redrawn from a Dirichlet distribution centred on the configured values and the market re-scored 500 times.
| Space | Baseline rank | In top set | Mean rank |
|---|---|---|---|
| Statin Combinations (sub-segment) | 1 | 100.0% | 1.11 |
| AHT Triple / Poly Combinations (sub-segment) | 2 | 99.4% | 1.91 |
| Rosuvastatin + Clopidogrel (molecule) | 2 | 99.8% | 2.27 |
| Cilnidipine + Telmisartan (molecule) | 1 | 98.8% | 1.91 |
| Cilnidipine + Metoprolol + Telmisartan (molecule) | 3 | 85.0% | 3.67 |
| Rosuvastatin + Ezetimibe (molecule) | 4 | 83.2% | 4.07 |
| Statins Plain (sub-segment) | 3 | 68.4% | 3.31 |
| AHT Dual Combinations (sub-segment) | 4 | 32.0% | 3.70 |
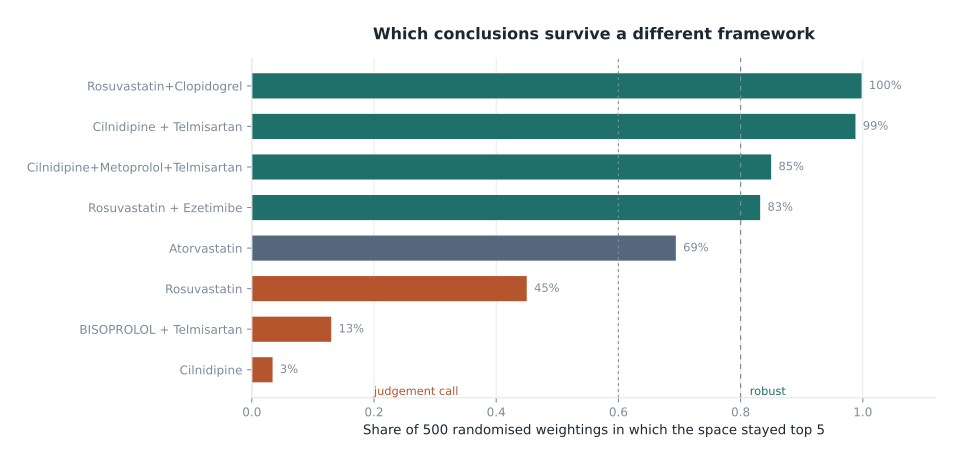
The two priority recommendations survive any reasonable weighting. The fourth and fifth entries on the top-five list do not, and are presented as candidates rather than conclusions.
What this analysis cannot tell you
Stated here rather than buried, because the recommendations should be read against it.
- Two years of history. Two annual observations support a trend, not a cycle. Five-year projections are structured extrapolation with an explicit mean-reversion assumption, not a plan.
- No patent or regulatory status. Freedom to operate on any specific combination requires legal review that is outside this dataset.
- No cost, margin or promotional data. Every conclusion is about revenue opportunity. Whether a space is profitable to enter, and what share of voice it would take, cannot be answered here.
- Retail audit only. Institutional, hospital and government-tender channels are not represented, which matters given the scale of public screening programmes [S-02].
- One geography. India only.
- External signals are curated, not exhaustive. Fourteen documents chosen for relevance. Their influence on the ranking is bounded to a narrow band by design, and centred within each level so that a signal applying to everything moves nothing.
Full detail in LIMITATIONS.md and ASSUMPTIONS.md.